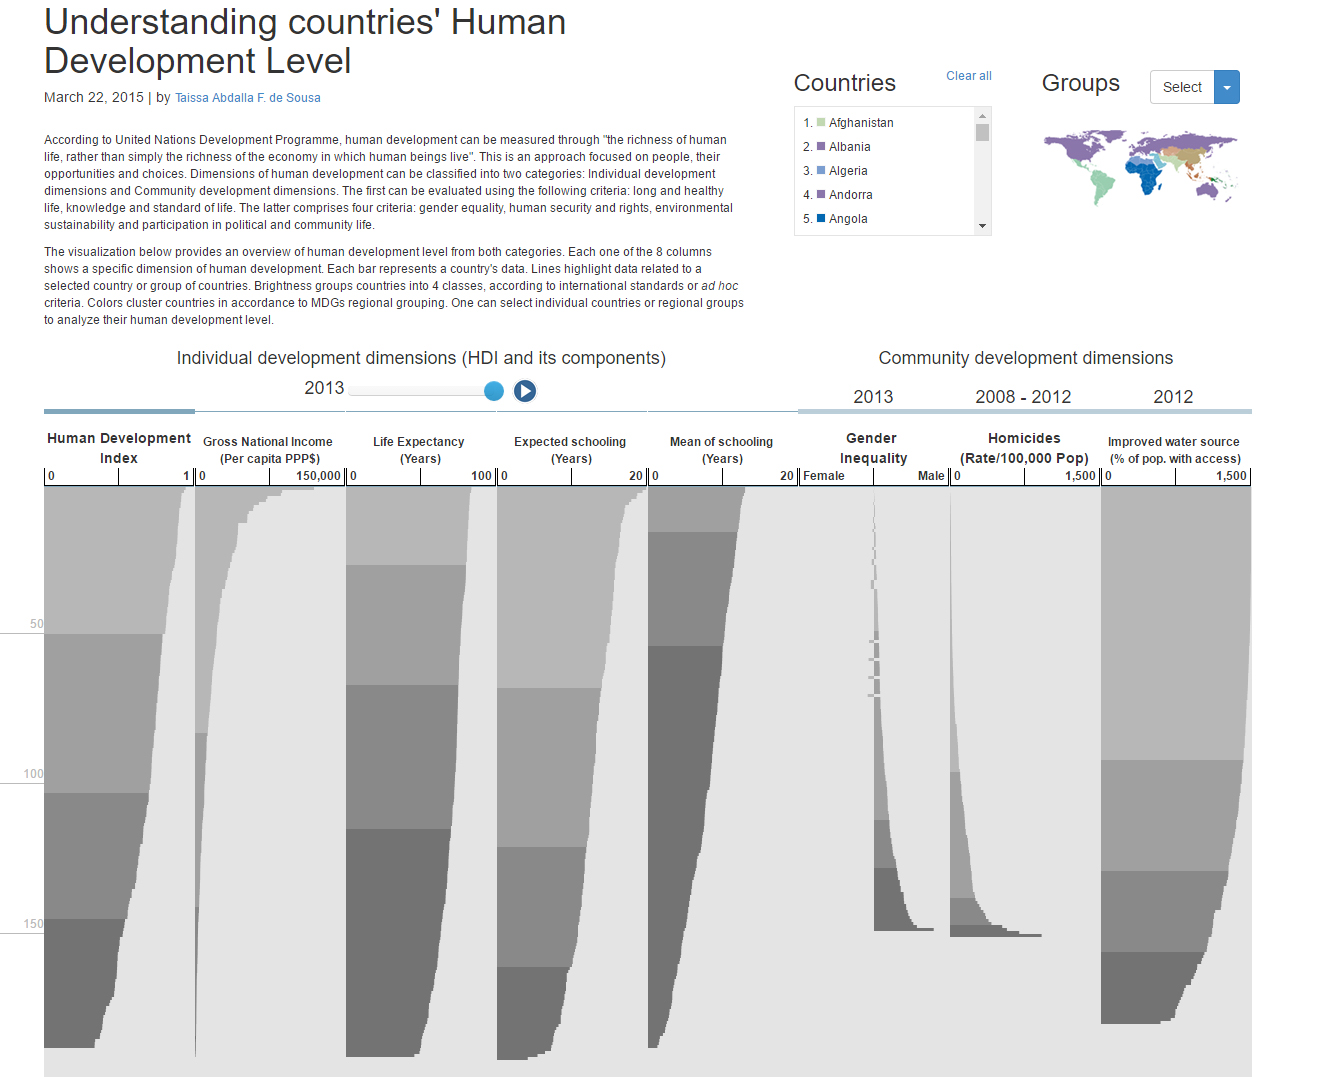
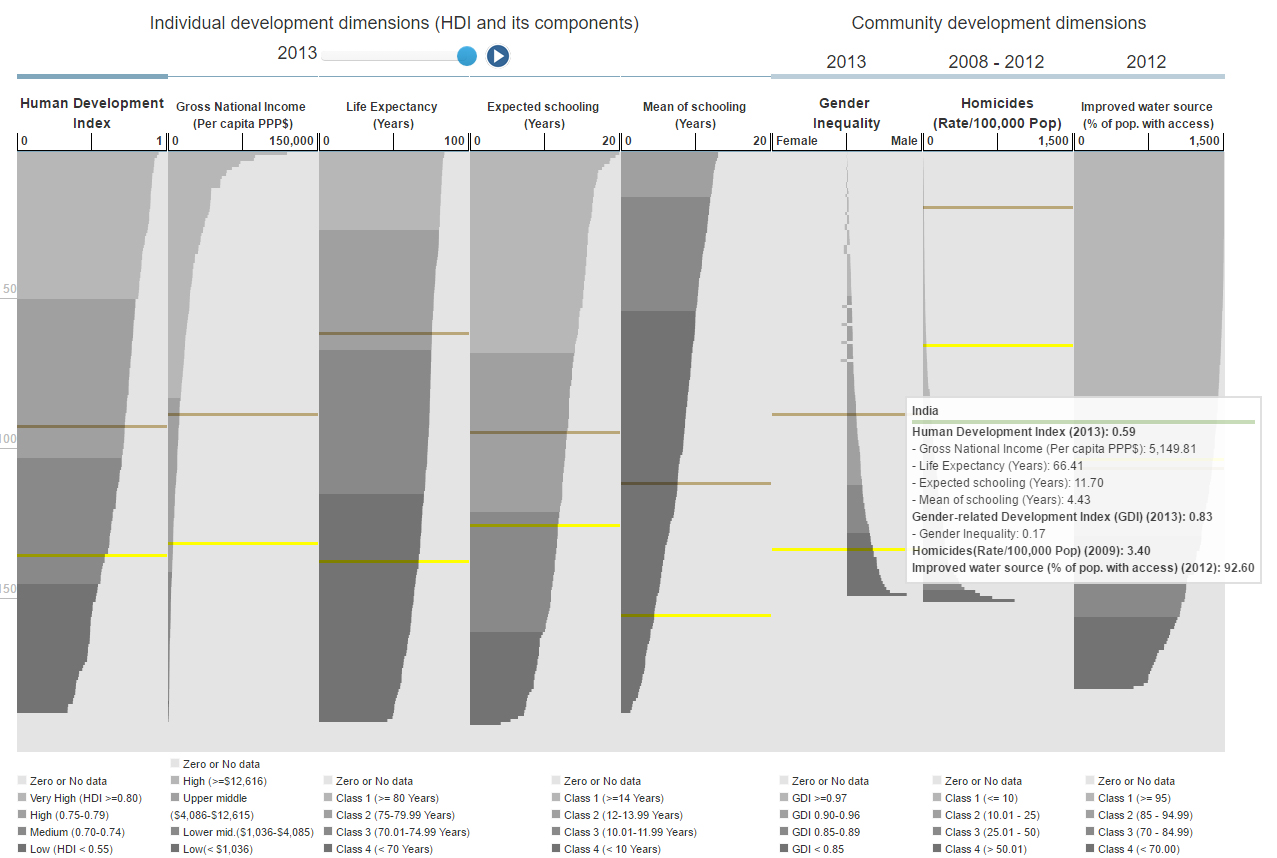
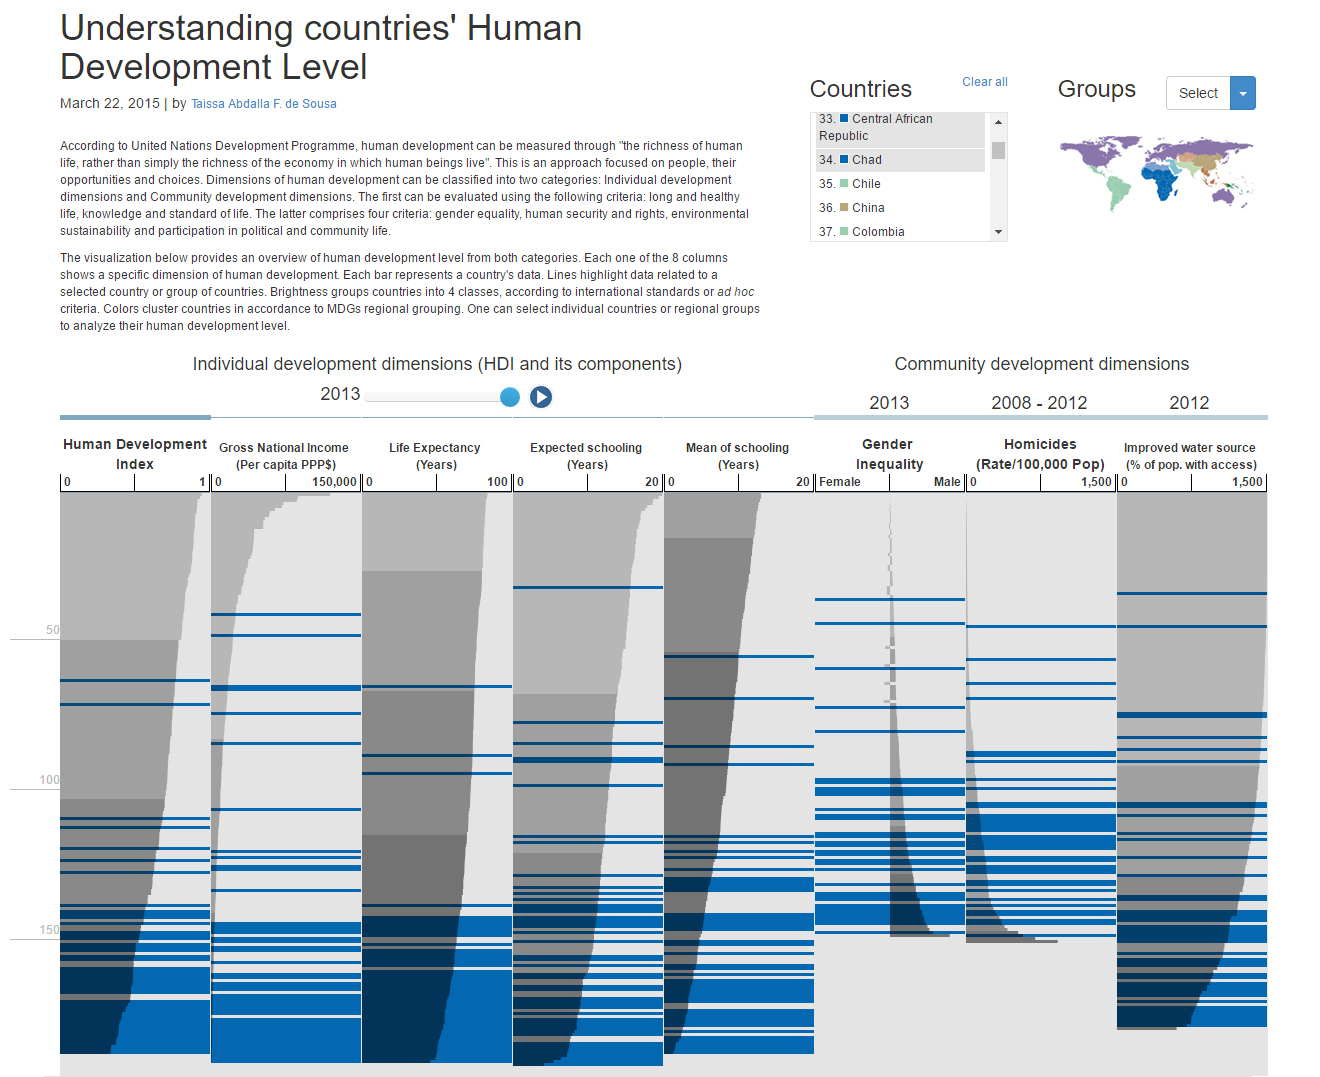
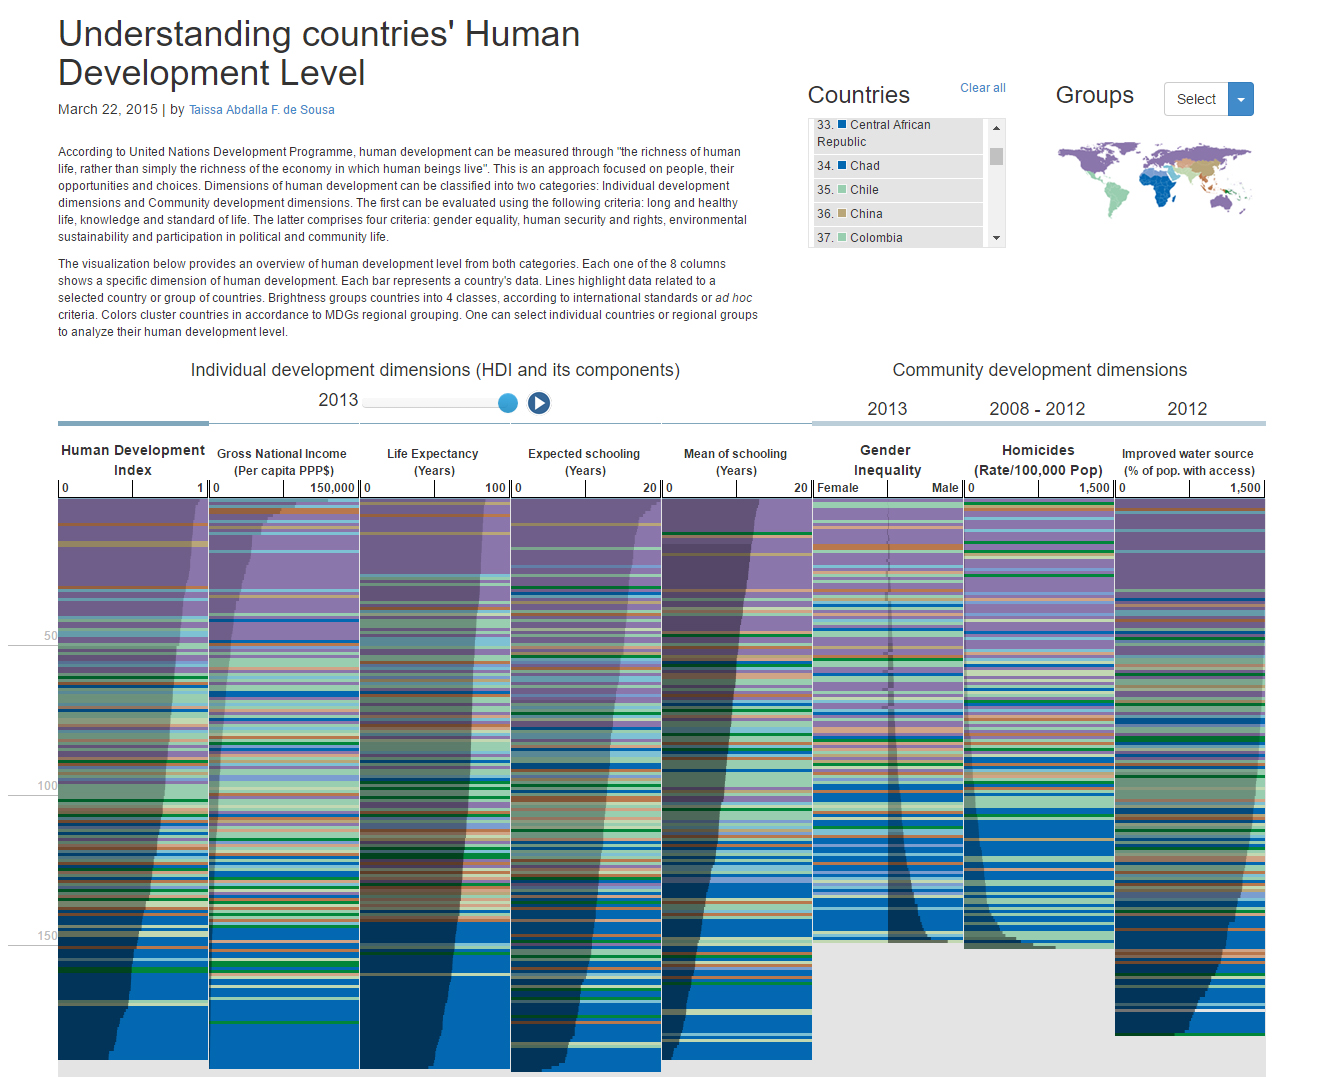
Visualizations of Human Development


Available at: http://taissasousa.com/datafest/visualization.htm


Duties: UI/UX, Data Visualization, Front-end development

Concepts & Methods: Storytelling, Human computer-Interaction, Interactive visualization

Tools & Tech: D3, Javascript, Jquery, CSS, HTML


Content and target group


According to United Nations Development Programme, human development can be measured through "the richness of human life, rather than simply the richness of the economy in which human beings live". This is an approach focused on people, their opportunities and choices. Dimensions of human development can be classified into two categories: Individual development dimensions and Community development dimensions. The first can be evaluated using the following criteria: long and healthy life, knowledge and standard of life. The latter comprises four criteria: gender equality, human security and rights, environmental sustainability and participation in political and community life.

Citizens from all over the world.

Selected indicators

- Human Development Index and its components
- Gender Inequality
- Homicide rates
- Improved water source


Goal: Create a beautiful visualization to answer:


How can the human development level of a country be best understood in one snapshot?


How might we best compare the indicators and data for different countries, and their evolution over time, and what insight might that yield?


How can you show the strengths of the different components that make up the indices for different countries, and how might that impact human-development focused policy in a country?


How can inequalities between countries, groups and genders be best illustrated and how might this impact the level of human development of a country?

Interface with default settings


Comparison of two countries and tooltip


Selection of sub-saharan African Countries


Selection of all countries: Comparison among regions


Thank you

Taissa Abdalla Filgueiras de Sousa

taissa.sousa@gmail.com


Now, visit the HDI visualizations.


Back to top