Understanding countries' Human Development Level

March 22, 2015 | by Taissa Abdalla F. de Sousa

According to United Nations Development Programme, human development can be measured through "the richness of human life, rather than simply the richness of the economy in which human beings live". This is an approach focused on people, their opportunities and choices. Dimensions of human development can be classified into two categories: Individual development dimensions and Community development dimensions. The first can be evaluated using the following criteria: long and healthy life, knowledge and standard of life. The latter comprises four criteria: gender equality, human security and rights, environmental sustainability and participation in political and community life.

The visualization below provides an overview of human development level from both categories. Each one of the 8 columns shows a specific dimension of human development. Each bar represents a country's data. Lines highlight data related to a selected country or group of countries. Brightness groups countries into 4 classes, according to international standards or ad hoc criteria. Colors cluster countries in accordance to MDGs regional grouping. One can select individual countries or regional groups to analyze their human development level.

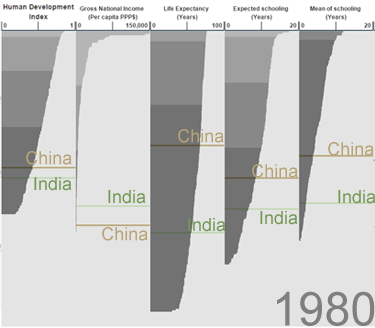
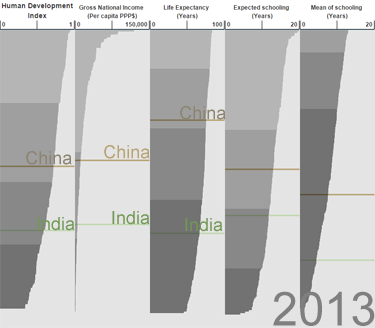
Individual development dimensions (HDI and its components)

2013

play

Community development dimensions

2013

2008 - 2012

2012

Zero or No data
Very High (HDI >=0.80)
High (0.75-0.79)
Medium (0.70-0.74)
Low (HDI < 0.55)
Zero or No data
High (>=$12,616)
Upper middle
($4,086-$12,615)
Lower mid.($1,036-$4,085)
Low(< $1,036)
Zero or No data
Class 1 (>= 80 Years)
Class 2 (75-79.99 Years)
Class 3 (70.01-74.99 Years)
Class 4 (< 70 Years)
Zero or No data
Class 1 (>=14 Years)
Class 2 (12-13.99 Years)
Class 3 (10.01-11.99 Years)
Class 4 (< 10 Years)
Zero or No data
GDI >=0.97
GDI 0.90-0.96
GDI 0.85-0.89
GDI < 0.85
Zero or No data
Class 1 (<= 10)
Class 2 (10.01 - 25)
Class 3 (25.01 - 50)
Class 4 (> 50.01)
Zero or No data
Class 1 (>= 95)
Class 2 (85 - 94.99)
Class 3 (70 - 84.99)
Class 4 (< 70.00)

Data Sources:
United Nations Development Programme - Human Development Reports - Human Development Index and its components
United Nations Development Programme - Human Development Reports - Gender-related Development Index
UNODC Homicide Statistics 2012 - United Nations Office on Drugs and Crime (UNODC)
Proportion of the population using improved drinking water sources, total (UNICEF)


Other Sources:
Millennium Development Goals Indicators - World and regional groupings
The World Bank - New Country Classifications
Human Development Index (HDI)
Gender Development Index (GDI)
Human Development Reports - About Human Development


Frequently Asked Questions

1. How can the human development level of a country be best understood in one snapshot?

By selecting a country, the graphic highlights the matching bars for all dimensions with available data. Thus, it is possible to visualize country’s data, the development classes it belongs to and its position among other countries within the dataset for each indicator. It allows thereby, in a moment of perception, understanding of multiple dimensions of human development.


2. How might we best compare the indicators and data for different countries, and their evolution over time, and what insight might that yield?

In order to compare two or more countries in a period, simply select countries for comparison. Each country’s data will be highlighted with the color of its regional group. Explore country indicators by pointing the mouse over them and ensure they have different colors.

To compare their HDI and components evolution, select another period by moving the slider bar or click at the “play” bottom to start animation. You can notice conditions changes in all of the selected countries.

The evolution comparison among countries can show what dimensions have improved and what need more attention from the government.

For instance: The figure 1 shows a comparison between China and India, in two instances (1980 and 2013). We observed China has had a higher performance, according to HDI. Whereas India has moved its HDI from low to medium level, China, also in low level in 1980, has achieved the high level in 2013. Analyzing China HDI components, we noticed that it is due to high increment in income and life expectation.


Figure1: Comparison of HDI and its components for China and India in 1980 and 2013


3. How can you show the strengths of the different components that make up the indices for different countries, and how might that impact human-development focused policy in a country?

By selecting a country, the graphic shows how good or how bad it is in each specific indicator. It is available the HDI and its components, composing the set of individual development dimensions, as well as indicators that point to indirect impacts in the population life quality and human development of the country. The results can be used to assess and redesign policies, by helping to identify improvement opportunities related to indicators with lower level of human development and reorganizing government policy priorities.


4. How can inequalities between countries, groups and genders be best illustrated and how might this impact the level of human development of a country?

The inequality among countries or country groups is presented as the distance among bars of selected countries. Regarding gender inequality, there is a specific indicator to present this issue.


Best visualization for Chrome Browser and resolution of 1280x760px and higher