Taissa A. F. de Sousa
Interaction & Visualization Designer, M.Sc. in Computer Science
April 2015 
Presentation at Cartagena Data Festival, Colombia (Official language: Spanish)
January 2015 
October 2014


September 2014

August 2014

June 2014
Recommender System to Support Chart Constructions with Statistical Data
Human Computer Interaction International 2014, Greece. Online ISBN 978-3-319-07233-3Taissa Abdalla Filgueiras de Sousa, Simone Diniz Junqueira Barbosa
Abstract:
Research on statistical data visualization emphasizes the need for systems that assist in decision-making and visual analysis. Having found problems in chart construction by novice users, we researched the following question: How can we support novice users to create efficient visualizations with statistical data? show more To address this question, we proposed ViSC, a recommender system that supports the interactive construction of charts to visualize statistical data. It explores a visualization ontology to recommend a set of graphs that help to answer information-based questions related to the current graph data. By traversing the recommended graphs through their related questions, the user implicitly acquires knowledge both of the domain and of visualization resources that represent the domain concepts of interest well. We report here a qualitative study conducted to evaluate ViSC using two methods: the Semiotic Inspection Method (SIM) and a Retrospective Communicability Evaluation (RCE). We first analyze how the questions influence the users' traversal through the graph and then address the broader question. We concluded the questions were important to generate efficient visualizations and thus, an efficient solution to help novice users in chart constructions. show less http://link.springer.com/chapter/10.1007%2F978-3-319-07233-3_58 | Power point
June 2014
Presentation at the "Taller Regional sobre Política de Divulgación de Microdatos", Costa Rica (Official language: Spanish)
March 2014
Presentation at the "Regional Workshop on the use of Mobile Technology for Data Collection and Statistical Production in Africa", Cabo Verde
December 2013
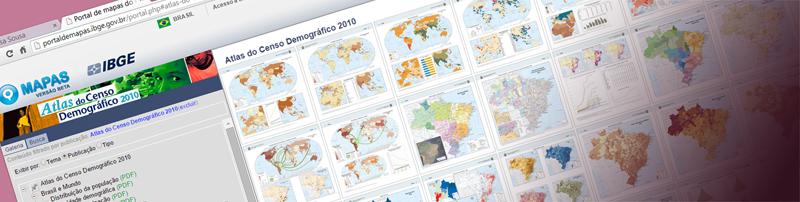
Find, visualize, create and share maps: the IBGE's Portal of Maps (beta version)
October 2013
Recommender System to Support Chart Constructions with Statistical Data (Portuguese version)
XIII Simpósito Brasileiro sobre Fatores Humanos em Sistemas Computacionais, Brazil. ISBN 978-85-7669-278-2Taissa Abdalla Filgueiras de Sousa, Simone Diniz Junqueira Barbosa
http://dl.acm.org/citation.cfm?id=2577136
See also the complete dissertation at:http://www.maxwell.vrac.puc-rio.br/22030/22030.PDF
June 2013
December 2012

December 2012
Semantic Characterization of Visualization Mechanisms
PUC-Rio, Monographs in Computer Science, ISSN 0103-9741Taissa Abdalla Filgueiras de Sousa, Simone Diniz Junqueira Barbosa
Abstract: Several researchers have shown the need to create forma meanings of different types of data visualizations. This concern includes not only scientific visualization, but also more general information visualization Lately, some projects have been conducted towards developing ontologies, creating semantic for visualization and making these representations amenable to computer processing. show more In this research, we investigated two recent ontologies — VisKo and UK National e-Science Center — aiming to bring new contributions to the field of information visualization. The goal of our research is to develop and ontology to define relationships between data model, visualizations and user tasks represented by questions. Our on tology involves some usual and unusual data structures that include Cartesian graphs, maps and hierarchical relationships and we defined questions that could be answered by these visualizations. show less ftp://ftp.inf.puc-rio.br/pub/docs/techreports/12_16_sousa.pdf
December 2012
How signification and communication systems influence the interpretation of statistical data by users with specific information needs
PUC-Rio, Monographs in Computer Science, ISSN 0103-9741Taissa Abdalla Filgueiras de Sousa, Simone Diniz Junqueira Barbosa
Abstract: Charts can represent and communicate quantitative information more efficiently than tables. However, their interpretation requires knowledge of graphic systems, which nowadays can be made efficient with the aid of interactive computer systems. Based on Semiotic Engineering, this paper reports a study on how communication and signification systems represented by Web visualization tools influence the interpretation of charts. show more We investigate the uses' abduction and sense-making process through the triangulation of two qualitative methods: Communicability Evaluation Method (CEM) and Think Aloud with co-participation. This first method allowed us to evaluate failures in the reception of the designer-to-user message, revealing features of the computational signs that hinder metacommunication. The second one allowed us to investigate the users' abductive processes during charts creation and to identify problems in understanding and generating charts using the investigated tools. show less ftp://ftp.inf.puc-rio.br/pub/docs/techreports/12_15_sousa.pdf
November 2009
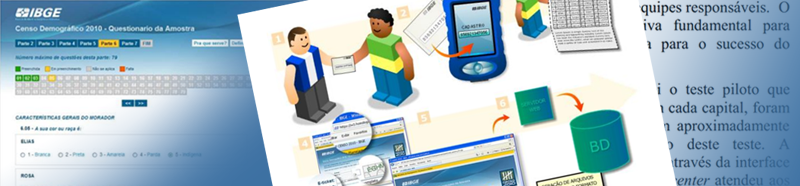
Interface design for the 2010 Census online Questionnarie
Interaction 09 | South AmericaTaissa Abdalla Filgueiras de Sousa, Luiz Agner
Abstract: In 2007, IBGE started to use mobile devices for data collection in household surveys. In 2010, the expectative is realize the data collection of Demographic Census also through the Internet. show more Based on the experience of data collection through the PDA obtained in previous projects, we developed a web interface to the Census 2010 for this purpose. The new interface aimed to address new paradigms of the switching from printed media to electronic media and the main challenges are motivate citizens to fill through the Internet and preserve the understanding of the concepts of the IBGE. show less Read full paper (Portuguese)
October 2008
Interface Design for Mobile Devices to Support Data Collection for Statistical Surveys
VIII Simpósito Brasileiro sobre Fatores Humanos em Sistemas Computacionais, BrazilTaissa Abdalla Filgueiras de Sousa, Luiz Agner
Abstract: Mobile devices have been used as an important tool for data collection by surveys institutes of all over the world. They have replacing the traditional questionnaire of paper by this technology. The innovation makes it possible to reduce the period before the dissemination of results and also minimizes human errors while filling forms, among other advantages. IBGE was one of the first institutes to use PDA for this purpose in 2007 with Census and PNAD surveys. show more In PNAD survey the replacement of a tool demanded a study of the interaction interface, since the new system allowed the inclusion of facilitating elements. Several user teams were available to use the new tool and share their experiences and needs in a cooperative evaluation. The change has succeeded all over Brazil. Nevertheless, the interface design can still be improved for future surveys. show less Read full paper (Portuguese)
August 2008
Interaction Design for Household Survey Supporting Systems through Mobile Devices
2º Congresso Brasileiro de Arquitetura de InformaçãoTaissa Abdalla Filgueiras de Sousa, Luiz Agner
Abstract: In 2007, IBGE started to use mobile devices for data collection in household surveys. The innovation makes it possible to reduce the period before the dissemination of results, among other advantages. In PNAD survey the replacement of a tool demanded a study of the interaction inter-face, since the new system allowed the inclusion of facilitating elements. show more Several user teams were available to use the new tool and share their experiences and needs in a cooperative evaluation. The change has succeeded all over Brazil. Nevertheless, the interface design can still be improved. show less Read full paper (Portuguese)
2007, 2008, 2009
June 2005
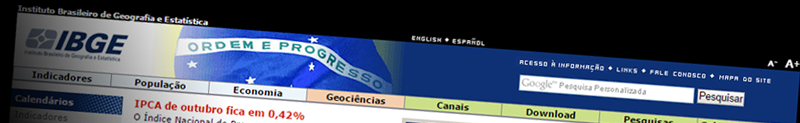
Preliminar evaluation of IBGE's portal according to Nielsen and Tahir guidelines
V USIHC – Congresso de Ergonomia e Usabilidade de Interfaces Humano-ComputadorTaissa Abdalla Filgueiras de Sousa, Luiz Paulo do Nascimento, Luiz Agner
Abstract: This paper presents and discusses the usability evaluation of a Brazilian government statistics institute website (IBGE) focusing its homepage. The analysis is based on a checklist of few usability guidelines. The goal is to improve the fitness of the site to its user needs and incentive new evaluation studies. Read full paper (Portuguese)
*The presented work developed for the United Nations and the IBGE have been developed during my contract in the respective organization and are intellectual properties of the own organization. The copyrights of papers and monographs, however, belong to me and to the co-authors described in each one and sources must be mentioned if it is used as reference in academic or business project.